USAGE NORMALISATION
For Yearly and Lifetime Trend Graphs
Typically, a user device will connect automatically to the visited institution’s wireless network (via the “eduroam” SSID) multiple times during one day as the user moves in and out of wireless coverage at the visited institution.
One user may carry several devices configured to connect to eduroam e.g. laptop and mobile phone.
For the purpose of usage metrics, multiple authentications by the same user during a day when visiting a particular institution are normalised to a single authentication event for that day.
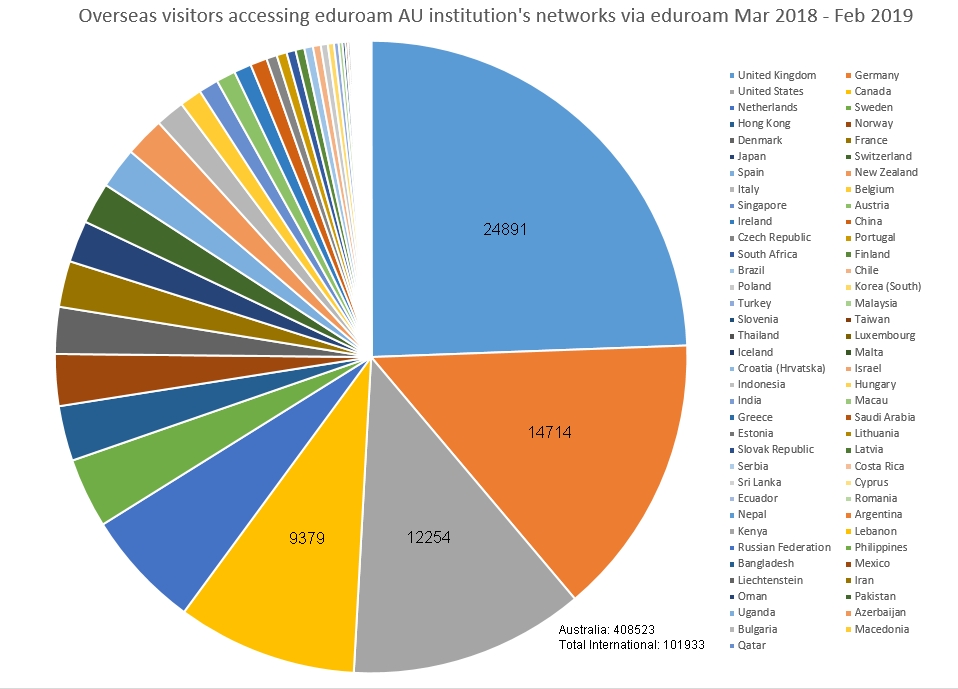
For International Visitor Pie Chart
Similarly users are normalised to unique users over the indicated time-period of international visitor pie charts.
EDUROAM AU YEARLY USAGE TREND AT END FEBRUARY 2019
Yearly Trend Statistics March 2018 – February 2019
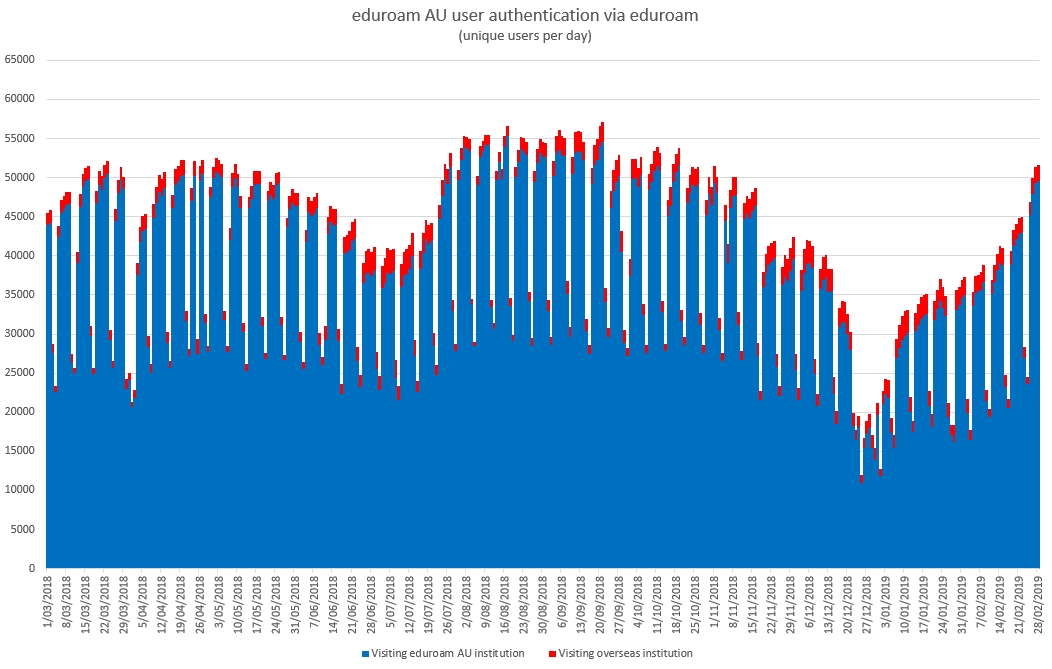
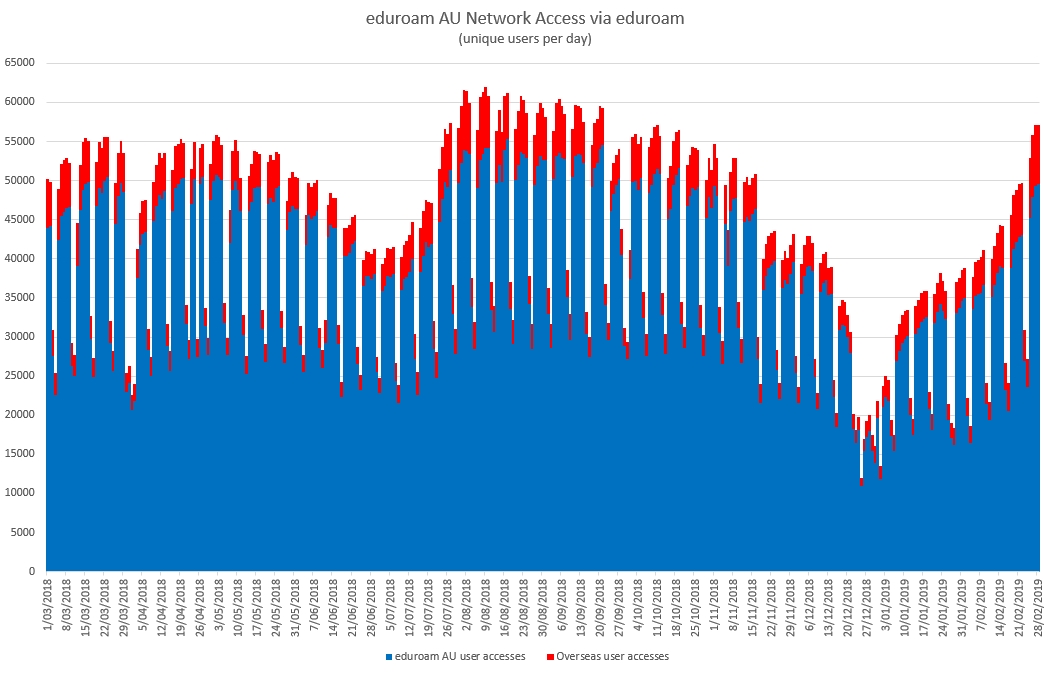
The following graphs depict usage of eduroam AU over the last year, unique users per day during the period March 2018 – February 2019.
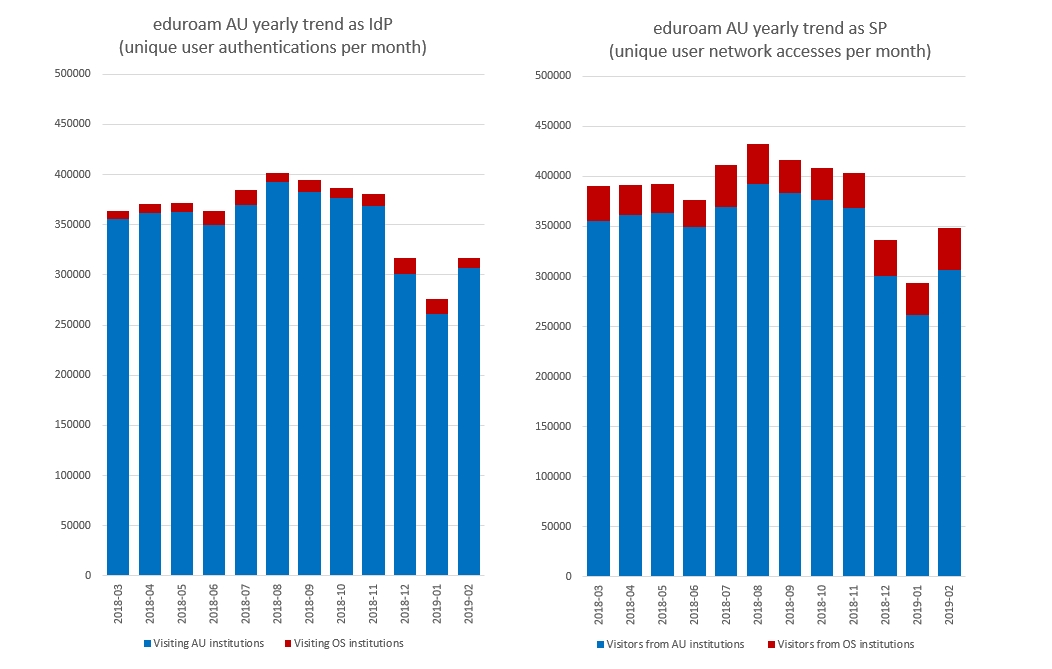
Yearly trend as an eduroam identity provider
Yearly trend as an eduroam service provider
Yearly trend of unique-user per month
International Visitors for Year Mar 2018 – Feb 2019
Number of unique users per country visiting AU and accessing eduroam AU SP networks during Mar 2018 - Feb 2019:
Lifetime trend as an eduroam identity provider
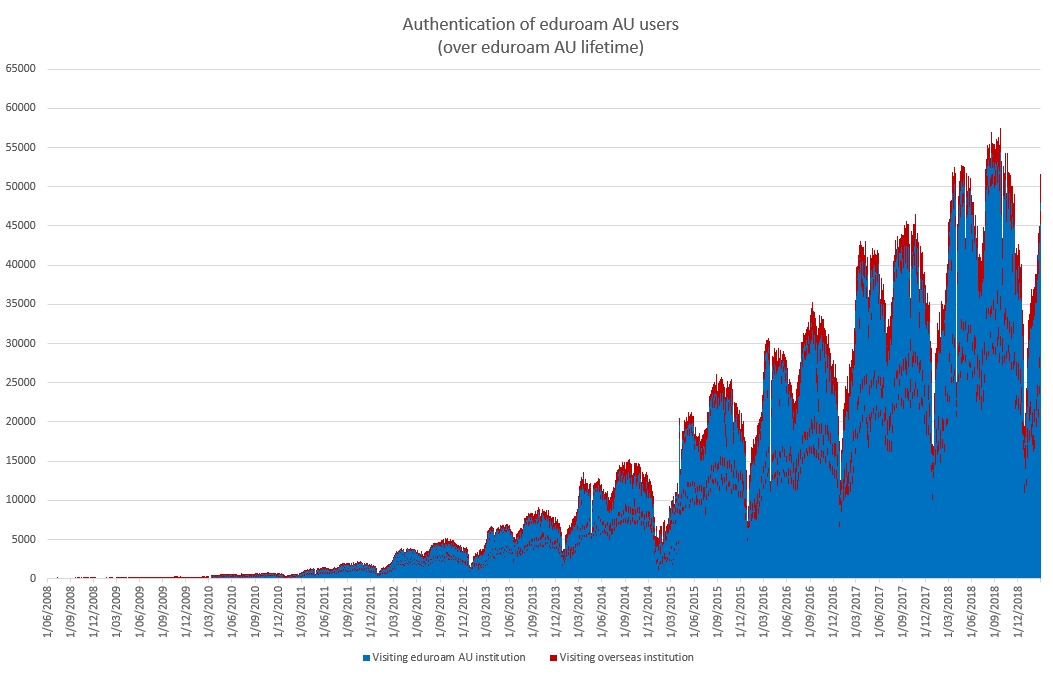
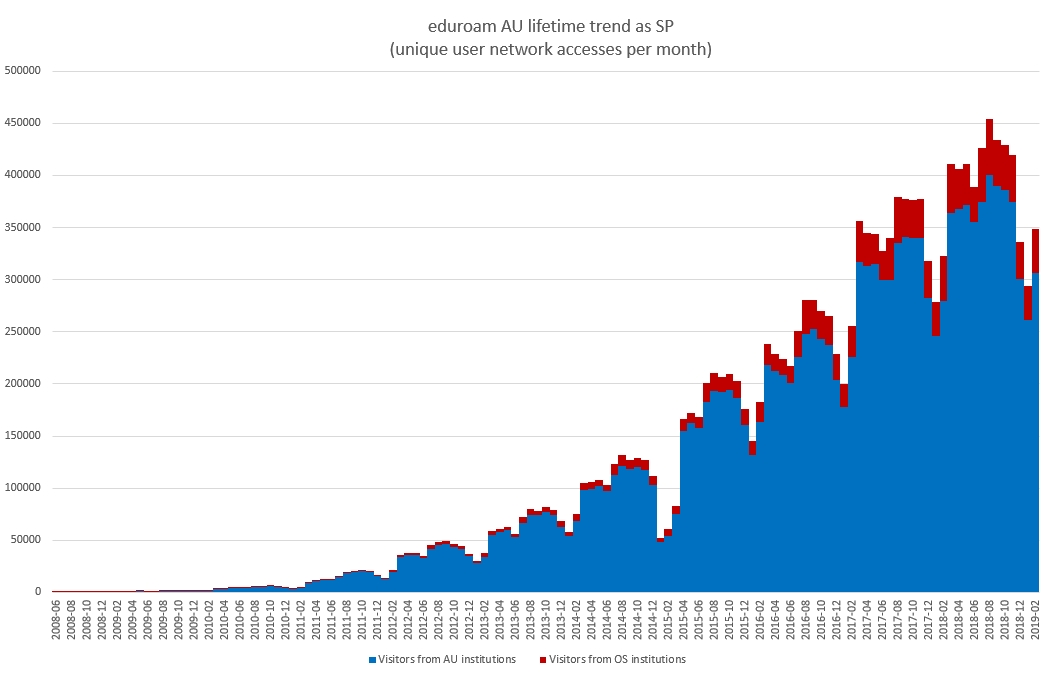
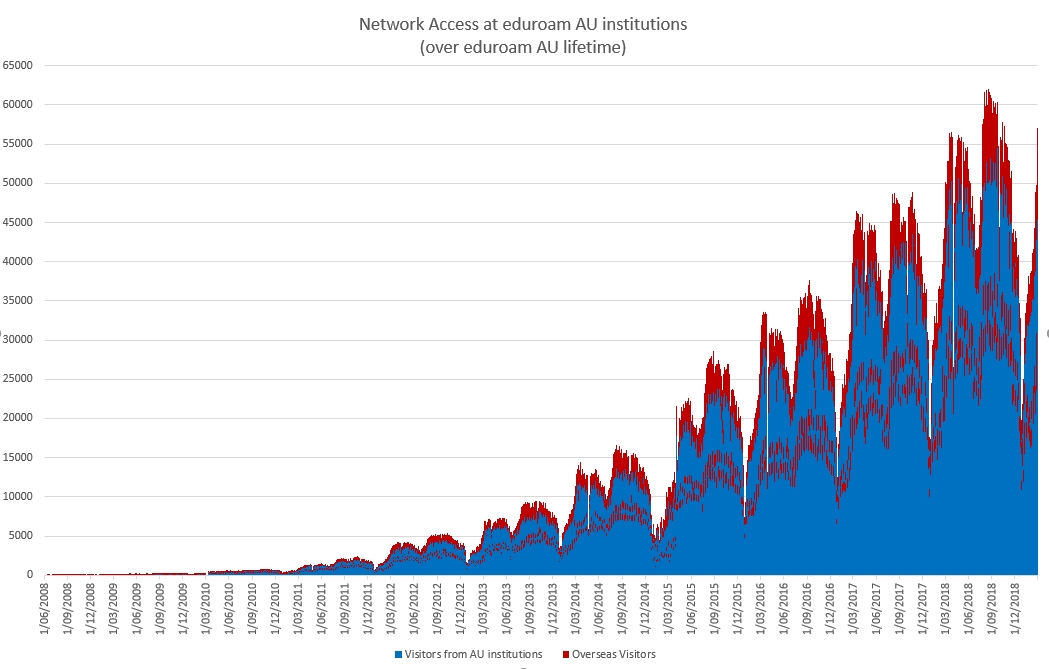
Lifetime trend as an eduroam service provider
Lifetime trend of unique users per month as an eduroam identity provider
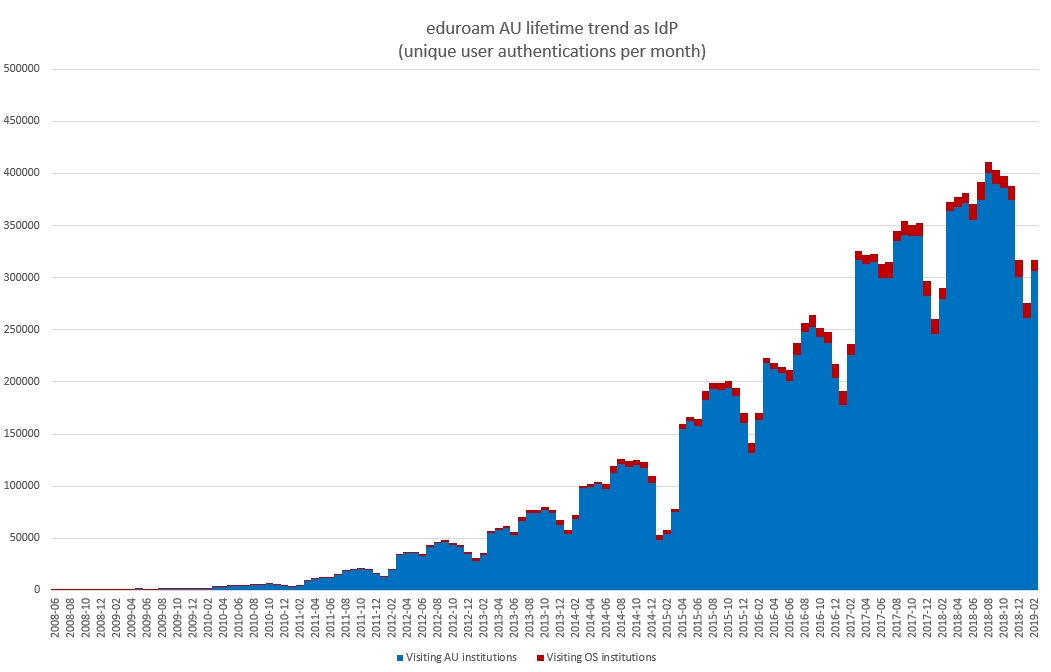
Lifetime trend of unique users per month as an eduroam service provider